OpticVyu Project-Planning Integration
Connect project planning with construction monitoring imagery to validate the scheduled events with visual data.
Connect project planning with construction monitoring imagery to validate the scheduled events with visual data.
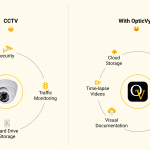
Ever wondered how construction images can be integrated with project planning data to see activity-based delays? OpticVyu integrates with the project planning data to enable the comparison of the images captured at the start & completion of an activity. The system will automatically map the camera images against the planned start & end of every activity. This makes it very simple to witness the state of job-site over the progress of an activity.
Export the planning data excel sheet from your planning tools like Microsoft-Project or Primavera. Or download the sample data sheet & edit it. We recommend uploading only major activities’ data to OpticVyu. Once the data is uploaded, it can be updated under the “Edit-Data” tab.
Event-based photo comparison allows users to check job-site status corresponding to the planned start & end date of an event. For example, the user may select a task say “excavation” to see its start & end date’s image.
If the delay is observed while comparison, the user can update the event’s actual start & end dates based on visual inspection through camera images.
The system process the events’ planned & actual date data & creates a Gantt chart for delay analysis.
Event time-lapse video is a derived feature of project planning integration with the construction camera. Event-based time-lapse videos can be created to check the project’s progress during the execution of an event. For example, you may customize an event time-lapse video for the “excavation” task to showcase the progress from the start to the end of the “excavation” activity.
The below video shows how to enable planning integration with the OpticVyu construction camera.